Portfolio
Data Analytics Projects Delivered
Please click on View Findings & Recommendations for detailed analysis insights.
Transport Analytics
✈️ Cleared for Takeoff: European Airport Traffic Analysis
- Analysed 116,020 records of daily flight movements across 331 unique airports in 42 European states for the full year 2025 — confirming zero null values and zero duplicates, indicating high data quality.
- Identified Istanbul Airport as Europe's busiest hub with 272,067 departures and 272,054 arrivals; Spain led all countries with 2,361,488 total flight movements, followed by the United Kingdom, France and Germany.
- Uncovered strong seasonal traffic patterns — July peaked at 1,683,171 total flights while February was the quietest month at 1,103,767. July 18th recorded the single busiest day (56,775 flights); Christmas Day the lowest (26,080).
- Confirmed 50+ major airports — including Paris CDG, London Heathrow and Vienna — operated without interruption on all 365 days of 2025, while Ventspils (Latvia) was the least active with just 18 records.
- Derived a traveller advisory insight recommending October–November as the optimal booking window for affordable European travel — shoulder-season pricing with minimal congestion compared to the summer peak.
Python
Pandas
Data Wrangling
EDA
Data Visualisation
Transport Analytics
📊 Visual Insights — Python Generated Charts
Tools Used: Python 3 | Pandas | Matplotlib | Jupyter Notebook
🗺️ Interactive Dashboards — Tableau Visualisations
Tools Used: Tableau Public | Data Source: European Airports Traffic Dataset 2025
👇 Look for the ✨ icon (multiple stars symbol) in the chart toolbar below — click it to open the full interactive dashboard in a new tab.
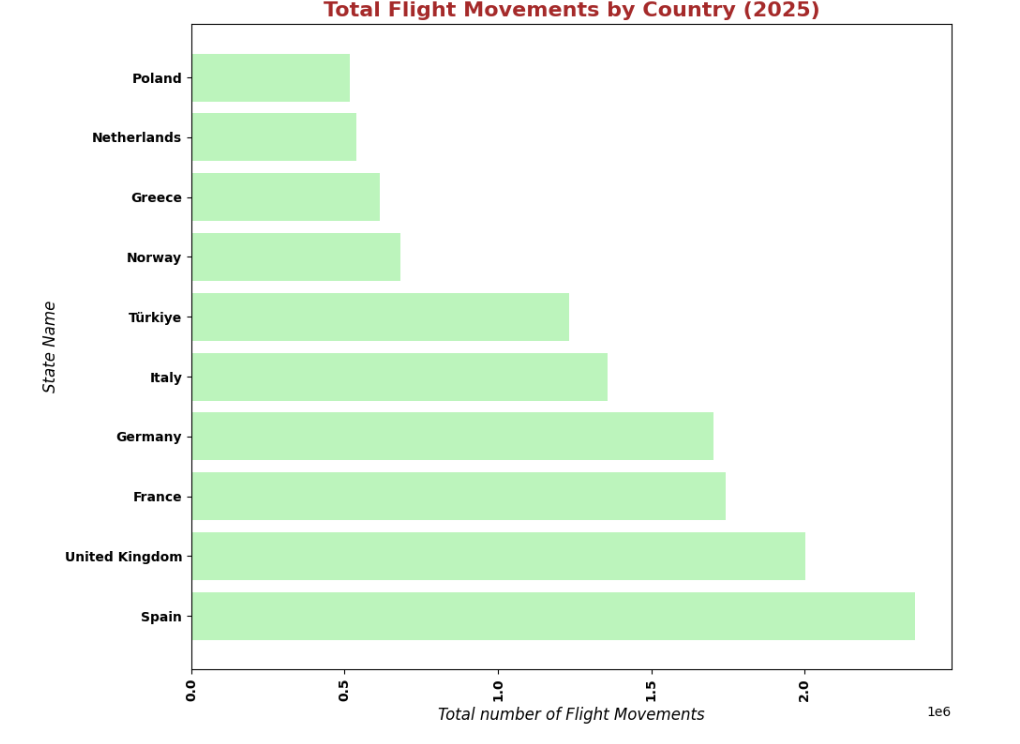
Total Flight Movements across European States (2025)

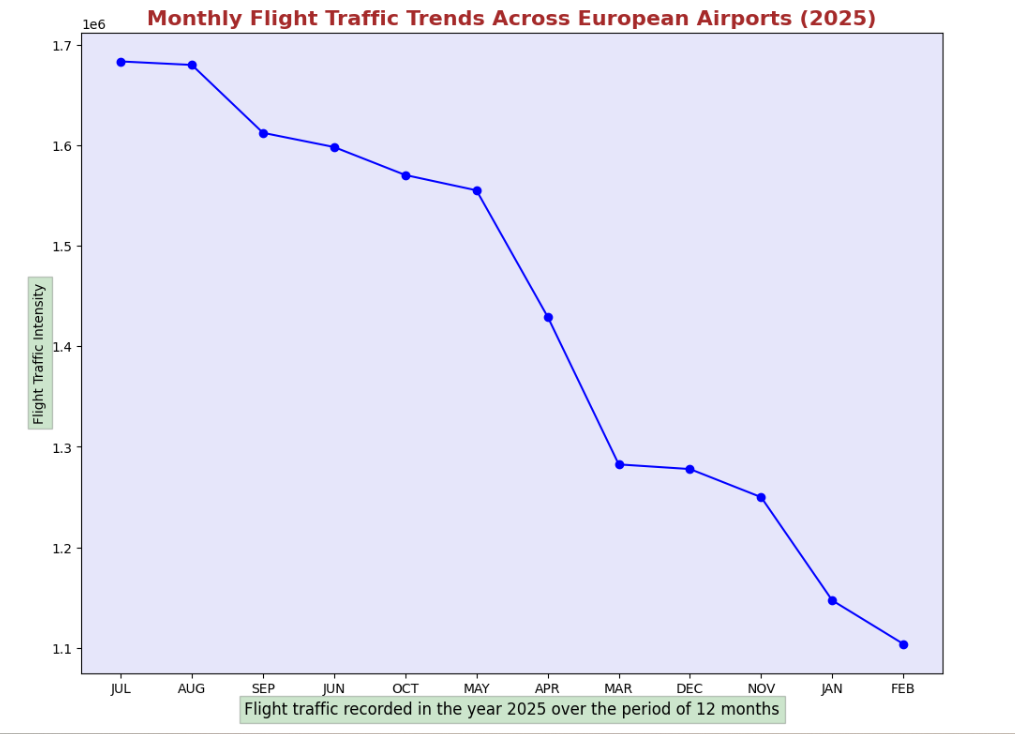
Monthly Flight Trends across European States (2025)

Flight Share by Season — European Airports (2025)

Flight Arrival Trends by Date — European States (2025)

Arrival vs Departure Flight Imbalance by Airport (2025)

Exploratory Data Analysis Findings
- Finding 1 — Busiest Airport — Departures & Arrivals: Istanbul Airport led Europe in both departures (272,067) and arrivals (272,054) in 2025, peaking in August with 25,378 departures in a single month. Amsterdam-Schiphol and London Heathrow followed closely, with departures and arrivals remarkably balanced across all top airports — indicating efficient traffic management.
- Finding 2 — Top Countries by Flight Movements: Spain dominated with 2,361,488 total movements, followed by the United Kingdom (2,002,205), France (1,741,728), Germany (1,704,444), Italy (1,358,471) and Türkiye (1,232,639). These six nations collectively handled the majority of European air traffic.
- Finding 3 — Peak & Quiet Months: July recorded the highest total movements at 1,683,171 and February was the quietest at 1,103,767 — a gap of nearly 580,000 flights between the busiest and quietest months, driven by Europe's summer tourism season.
- Finding 4 — Busiest Single Day: July 18th, 2025 recorded 56,775 total flights — the highest single-day movement of the year — falling at the height of Europe's summer travel peak.
- Finding 5 — Christmas Day — Lowest Single Day: December 25th recorded just 26,080 flights — less than half of the peak day — as most travellers completed journeys before the holiday and chose to remain at their destination.
- Finding 6 — Post-Holiday January Slump: January 21st recorded just 32,669 flights, reflecting the well-known post-holiday slowdown where reduced consumer spending and airline schedule cuts suppress demand through the month.
- Finding 7 — Airports Operating All 365 Days: Over 50 airports — including Vienna, Brussels, Prague, Copenhagen, Helsinki, Paris CDG and Paris Orly — appeared 365 times in the dataset, confirming uninterrupted daily operations throughout the year.
- Finding 8 — Least Active Airports: Ventspils (Latvia) was the least represented airport with only 18 records, followed by Palma-Son San Juan (58), Lučko (92) and Sligo (101) — operating with significantly limited flight schedules.
- Finding 9 — Country Airport Record Density: France held the highest airport record count (22,205 entries), followed by Spain (18,090) and Norway (15,256) — indicating the most extensive airport networks with frequent daily reporting.
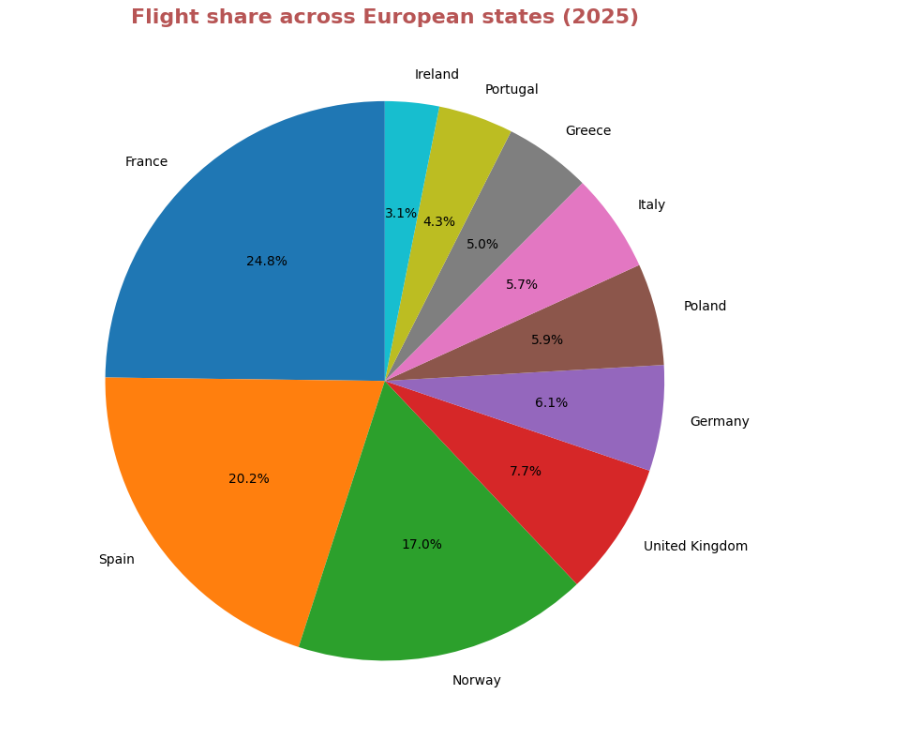
- Finding 10 — Flight Share Among Top 10 Countries: France led at 24.8% of all flight activity, followed by Spain (20.2%), Norway (17%) and the United Kingdom (7.7%). Together these four nations accounted for nearly 70% of all recorded European flight movements.
- Finding 11 — Arrivals vs Departures Overall Balance: Total arrivals (8,597,593) marginally exceeded total departures (8,590,521) across all European airports in 2025 — a difference of just 7,072 flights. This near-perfect balance reflects efficient airport slot coordination, with the slight arrival surplus likely attributed to inbound international flights originating outside Europe.
- Finding 12 ✈️ — Airports with Highest Arrival Surplus: Airports like Gerona (606), Cologne-Bonn (506), Valladolid (454), Muenster-Osnabrueck (391) and Athens (389) recorded significantly more arrivals than departures. These airports function as strong destination hubs, attracting more inbound travellers than outbound — indicating high tourism or business appeal in their regions.
- Finding 13 🚀 — Airports with More Departures than Arrivals: Sabadell (-968), Madrid-Cuatro Viento (-526), Toulouse-Blagnac (-289) and Burgos (-233) recorded significantly more departures than arrivals. This strongly suggests these regions serve as origin points where people prefer to depart to other cities rather than receive incoming visitors — indicating relatively lower inbound tourism appeal.
- Finding 14 🌍 — Countries with Highest Arrival Surplus: Germany (2,040), France (1,848), Italy (849) and Greece (506) recorded the highest arrival surpluses at country level. These nations are clearly the most preferred tourist destinations in Europe — attracting significantly more inbound travellers than they send out — confirming their status as top European tourism powerhouses.
- Finding 15 📉 — Countries with More Departures than Arrivals: Portugal (-92), Switzerland (-68) and Morocco (-16) recorded more departures than arrivals at country level. Residents of these countries tend to travel outward more frequently than they receive visitors — pointing to strong outbound travel culture among their populations.
- Finding 16 📊 — Near Perfect Correlation Between Departures, Arrivals and Total Flights: Correlation analysis revealed a near-perfect relationship (0.9995) between departures and arrivals across all European airports in 2025. This confirms that European flight traffic is highly symmetrical and balanced — every departure generates a corresponding arrival, reflecting the fundamental nature of commercial aviation where aircraft operate on balanced return routes.
- Finding 17 🌸 — Spring Season Dominated Total Flight Traffic: Spring recorded the highest total flight movements of 4,962,460 — surpassing even Summer (4,836,104). This reveals that European travellers show a strong preference for Spring travel, likely driven by Easter holidays, school breaks, and pleasant weather conditions across the continent.
- Finding 18 ☀️ — Summer Closely Followed Spring: Summer recorded 4,836,104 total flight movements, closely behind Spring by just 126,356 flights. Together Spring and Summer accounted for nearly 57% of all annual flight activity — confirming the warm weather months as the dominant travel period across Europe.
- Finding 19 ❄️ — Autumn Recorded Lowest Seasonal Traffic: Autumn recorded the lowest seasonal flight movements at 3,291,827 — significantly lower than all other seasons. As school terms resume and holiday periods end across Europe, travel demand drops sharply making Autumn the quietest season for European aviation.
- Finding 20 🏆 — Istanbul is Europe's Single Busiest Airport: Istanbul Airport recorded the highest total flight movements of any single airport in 2025 with 544,121 flights — making it the undisputed busiest airport in Europe. Amsterdam-Schiphol (493,042) and London Heathrow (480,072) followed in second and third place respectively.
- Finding 21 🥇 — Top 5 Busiest Airports in Europe 2025: The top 5 busiest airports by total flight movements were Istanbul-Türkiye (544,121), Amsterdam-Schiphol-Netherlands (493,042), London Heathrow-United Kingdom (480,072), Paris Charles-de-Gaulle-France (479,761) and Frankfurt-Germany (460,295). These five airports collectively serve as the backbone of European aviation connectivity.
- Finding 22 📈 — Denmark Has Highest Average Daily Flights Per Airport: Denmark recorded the highest average daily flight movements per airport at 703 flights per day — significantly ahead of Türkiye (562) and Finland (427). This reflects Denmark's highly concentrated and efficient single-airport model through Copenhagen Kastrup, which handles the vast majority of national air traffic.
- Finding 23 🇹🇷 — Türkiye Consistently Dominates Multiple Aviation Metrics: Türkiye secured top positions across multiple aviation metrics in 2025 — ranking first in single airport total flights (Istanbul 544,121), second in average daily flights per airport (562), and leading in overall flight volumes. Türkiye's civil aviation sector operated at an exceptionally high scale in 2025, suggesting highly competitive and affordable airline fares driving strong passenger demand.
Recommendations to Business Owners & Stakeholders
- Scale capacity ahead of summer peaks: Airlines and airport operators should initiate capacity planning (staffing, gate allocation, ground services) by April to absorb the July–August surge. July alone accounted for over 1.68 million movements — operational readiness well in advance prevents bottlenecks and delays during the busiest travel window.
- Invest in route development for underperforming airports: Airports with fewer than 100 annual records (Ventspils, Lučko, Sligo) represent untapped connectivity opportunities. Regional governments and aviation authorities should evaluate incentive programmes or new route subsidies to integrate these hubs into broader European networks.
- Leverage shoulder-season pricing for competitive advantage: Travel platforms, airlines and tourism boards should actively promote October and November fares — demand is lower, pricing is competitive, and weather across much of Europe remains favourable. A targeted marketing push during this window can redistribute demand away from peak congestion periods.
- Benchmark against Istanbul, Amsterdam and Heathrow for operational best practices: The near-perfect balance between arrivals and departures at the top three airports reflects exemplary traffic management. Hub airports looking to improve efficiency should study and adopt similar scheduling discipline and real-time flow coordination strategies.
- Use country-level traffic data to prioritise international expansion: With Spain, UK, France and Germany collectively handling the bulk of European movements, airlines evaluating new international routes should prioritise these markets first. Secondary markets such as Italy and Türkiye represent high-growth opportunities given their strong absolute volumes and tourism appeal.
- Plan reduced operations efficiently during December–January: The predictable slump across Christmas and January provides an ideal window for scheduled maintenance, runway works and infrastructure upgrades with minimal passenger disruption. Airports and airlines should coordinate maintenance calendars around this period rather than during high-demand months.
Retail Analytics
🍫 Chocolate Retail Analytics: Sales Performance, Customer Insights & Profit Prediction
- Analyzed 1M+ chocolate retail transactions across 100 stores, 200 products, and 50,000+ customers spanning 2023–2024; performed end-to-end data cleaning and feature engineering on a 33-column merged dataset using Python (Pandas).
- Identified customers aged 60+ as the highest-order segment; pinpointed Toronto, Paris, and London as top cities by volume and Store S074 as the highest-profit location.
- Uncovered seasonal revenue peaks — Summer ($8.5M) and Winter ($8.3M) — and found that a 20% discount ceiling drove sales spikes across key product lines.
- Identified P0107 and P0091 as the top revenue and profit contributors across all 200 SKUs through product-level profitability analysis.
- Built and compared Linear Regression (R² = 0.85) and Random Forest (R² = 0.93, no overfitting) models to predict profit from 16 input features; delivered recommendations on inventory prioritization, targeted marketing, and discount strategy.
Python
Pandas
Scikit-learn
Random Forest
Linear Regression
EDA
Data Visualizations
👇 Look for the ✨ icon (multiple stars symbol) in the chart toolbar below — click it to open the full interactive dashboard in a new tab.
Maximum Profit-Making Countries

Top 20 Highest Total Sales Per Order

Age Group Profit Leaders – Who Spends More on Chocolate?

Do Higher Discounts Drive More Profit? Store-Level Analysis

Findings
- Customers aged 60+ placed the highest volume of orders, making them the most valuable age segment by purchase frequency.
- Summer and Winter were peak revenue seasons at $8.5M and $8.3M respectively — Spring and Autumn trailed significantly.
- Toronto, Paris, and London ranked as the top three cities by order volume, contributing a disproportionate share of total sales.
- Store S074 was the single highest profit-generating location across all 100 stores, indicating a replicable success model.
- Products P0107 and P0091 were the top contributors to both revenue and profit across all 200 SKUs.
- A 20% discount ceiling consistently drove the highest sales spikes — discounts beyond this threshold showed diminishing returns on margin.
- The Random Forest model achieved R² = 0.93 (train: 0.934, test: 0.933) with no overfitting, outperforming Linear Regression (R² = 0.85) in capturing non-linear profit drivers across 16 business features.
Recommendations to Business Owners & Stakeholders
- Target the 60+ customer segment — Design loyalty programs, senior-focused promotions, and personalised campaigns for this high-frequency group to increase customer lifetime value.
- Build seasonal inventory plans — Pre-stock high-demand SKUs well ahead of Summer and Winter to prevent stockouts during peak revenue windows and avoid lost sales.
- Concentrate marketing in top cities — Prioritise spend and promotional activity in Toronto, Paris, and London for the highest return on marketing investment.
- Replicate the Store S074 model — Audit S074's operations, staffing mix, and local strategy to identify transferable practices that can lift performance at lower-ranked stores.
- Amplify P0107 and P0091 — Centre bundle deals, shelf placement, and visibility campaigns around these two SKUs to maximise revenue and profit contribution.
- Enforce a 20% discount cap as pricing policy — Deeper discounts erode margins without proportional volume uplift; a hard ceiling protects profitability while still driving volume spikes.
- Deploy the Random Forest model for profit forecasting — Use the 16-feature model for quarterly profit projections to guide inventory planning, budget allocation, and promotional scheduling.
Marketing Analytics
📊 Future Edge Developments – Client Performance Dashboard
- Integrated web analytics data from 4 connectors (Google Search Console, Google My Business, GA4, SEMrush) for a real client (ABC Company) to build a unified performance analytics pipeline.
- Performed EDA on Google Search Console data — identified avg. clicks = 2, avg. CTR = 0.32, and avg. impressions = 67 per landing page; ranked top 20 queries by impressions.
- Applied Linear Regression (impressions vs CTR, R = 0.003) — concluded CTR is not driven by impressions but by content quality, seasonality, and market competition.
- Applied K-Means clustering (5 clusters) on demographic data — Cluster 1 (dominant, US-based customers) vs Cluster 4 (least active, Dominican Republic); segmented high and low engagement users.
- Built Multiple Linear Regression on Google My Business data (website clicks, total actions, reviews) — R = 0.516, F = 32.74, p < 0.01, confirming a statistically significant moderate positive correlation.
- Applied Prophet and SARIMA forecasting — predicted slight decline in impressions, steady 1–3 website clicks/day, flat phone engagement, and no expected future spikes without intervention.
- Designed and delivered a comprehensive real-time Performance Analytics Dashboard in Looker Studio, enabling business owners and stakeholders to monitor KPIs, traffic trends, engagement metrics, and forecasts in one centralised view.
Google Search Console
Google My Business
Looker Studio
K-Means Clustering
Linear Regression
Prophet
SARIMA
Findings
- Each landing page averages only 2 clicks, a CTR of 0.32%, and 67 impressions — indicating the site has search visibility but fails to convert it into traffic.
- Linear Regression (R = 0.003) confirmed CTR has no positive linear relationship with impressions — impressions alone are not driving engagement; content and page quality are the bottleneck.
- K-Means clustering (5 clusters) revealed the majority of customers are US-based (Cluster 1), while Cluster 4 — customers from the Dominican Republic — shows minimal activity, signaling an untapped or underserved market.
- Multiple Linear Regression on Google My Business data (R = 0.516, F = 32.74, p < 0.01) showed a statistically significant moderate correlation between website clicks, total actions, and reviews — positive reviews drive measurable business activity.
- Prophet forecasting showed a slight but steady decline in future impressions — visibility is eroding without active SEO investment.
- SARIMA forecasting projected website clicks at a flat 1–3/day with no upward trend and phone clicks nearly flat — engagement will remain stagnant without optimization.
- Built a comprehensive real-time Performance Analytics Dashboard in Looker Studio — integrating all 4 data sources into a single live view covering traffic, CTR, impressions, engagement, and forecast trends for business owners to monitor at a glance.
- Overall conclusion: the company has reasonable search visibility but critically weak engagement; future performance will plateau unless targeted action is taken.
Recommendations to Business Owners & Stakeholders
- Strengthen Local SEO & Location-Based Search Visibility — Optimize Google Business Profile with accurate NAP data, local keywords, and location-specific content to capture high-intent nearby searches.
- Improve Landing Pages to Increase CTR — Since CTR is not correlated with impressions, invest in compelling meta titles, descriptions, and page content that match user search intent and convert impressions into clicks.
- Boost User Engagement Channels — Website and phone click forecasts signal low customer activity; introduce clear calls-to-action, live chat, and click-to-call buttons to make it easier for visitors to engage.
- Increase Brand Awareness & Market Reach — Expand into social media and paid search to supplement organic visibility and reach audiences beyond the current US-dominant cluster.
- Optimize for High-Intent Keywords — Shift keyword strategy from broad-reach terms (high impressions, low CTR) to transactional, high-intent queries that attract users ready to take action.
- Monitor & Enhance Service Pages Regularly — Add optimized keyword-rich content to service pages and track performance weekly; pages that decline in impressions should be refreshed or consolidated.
- Actively Solicit Customer Reviews — MLR results confirm reviews positively correlate with website clicks and total actions; a structured review generation process will directly lift business activity metrics.
- Use the Looker Studio Dashboard for Ongoing Monitoring — The real-time dashboard built for this engagement consolidates all KPIs across Search Console, Google My Business, GA4, and SEMrush in one place; business owners should review it weekly to track the impact of any optimization changes and course-correct quickly.
NLP & Machine Learning
🤖 Analyzing Amazon Customer Reviews: Text Processing, Topic Modeling & Sentiment Classification
- Built a scalable NLP data pipeline — tokenization, stop word removal, lemmatization, and TF-IDF vectorization — to convert raw Amazon review text into structured numerical data ready for modelling.
- Mapped customer ratings into three sentiment classes (Negative, Neutral, Positive) and performed supervised classification using Logistic Regression (baseline, 89.08% accuracy) and a Feed-Forward Neural Network (advanced, more balanced on neutral sentiments, within 0.2% of LR accuracy).
- Conducted unsupervised topic modelling using Latent Dirichlet Allocation (LDA) — surfaced 5 prominent customer discussion areas: positive feedback, customer support, fair service terms, product durability, and services.
- Identified that neutral sentiment classification posed the greatest challenge for Logistic Regression; the Neural Network addressed this with more robust and balanced class-level performance.
- Extracted actionable insights from sentiment patterns to support data-driven improvements to Amazon's customer experience ecosystem.
Python
NLP
TF-IDF
LDA
Logistic Regression
Neural Network
Scikit-learn
Findings
- TF-IDF vectorization successfully transformed unstructured review text into a numerical representation suitable for both supervised and unsupervised modelling at scale.
- Logistic Regression achieved 89.08% accuracy as a baseline but struggled with neutral sentiment classification — a common challenge in three-class sentiment tasks where neutral boundaries are ambiguous.
- The Feed-Forward Neural Network delivered more robust and balanced classification across all three sentiment classes, closing the neutral sentiment gap with only a 0.2% accuracy difference from Logistic Regression overall.
- LDA topic modelling (5 topics) revealed that customer discussions cluster around: positive product experiences, customer support friction, service term clarity, product durability concerns, and general service quality.
- Customer support and product durability emerged as the two highest-friction discussion areas, indicating systemic pain points across the platform that go beyond individual seller performance.
- Positive sentiment, while prominent, is concentrated in specific product categories — suggesting that quality is not evenly distributed across the seller ecosystem.
Recommendations to Business Owners & Stakeholders
- Leverage positive feedback as a performance benchmark — Identify product categories and sellers consistently driving positive sentiment; document their practices and share them across the seller ecosystem to replicate high-quality customer experiences at scale.
- Strengthen customer support infrastructure — Customer support surfaced as a heavily discussed friction point; invest in faster response times, AI-assisted chat support, and a structured escalation process to resolve issues before they convert into negative sentiment.
- Increase transparency around service terms — Fair service terms emerged as a recurring concern; simplify return policies and subscription conditions, improve their visibility at point of purchase, and proactively communicate any policy changes to existing customers.
- Implement stricter product durability standards — Product durability discussions reflect inconsistent quality across the platform; strengthen quality control thresholds for third-party sellers and flag underperforming products before negative sentiment accumulates at scale.
- Personalise and optimise the overall service experience — Broad service-related discussions reflect unmet expectations across customer segments; prioritise tailored recommendations, loyalty-based rewards, and proactive delivery experience improvements informed by the sentiment patterns from this analysis.